Making Sense of Social Data
Aussi disponible en français : Comprendre les données sociales
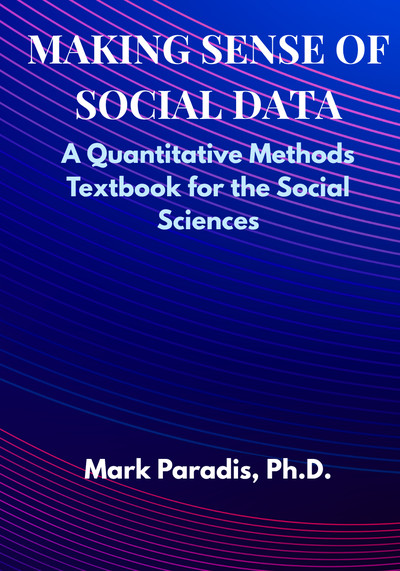
Making Sense of Social Data
A Quantitative Methods Textbook for the Social Sciences
First edition · 2026 · Mark Paradis, Ph.D. · 785 pages · ISBN 9798171290870
Most students meet research design in one course and statistics in another, and never quite see that they are the same subject. This book teaches them together: how a question becomes a measurable concept, how a concept becomes data, and what you are entitled to conclude once you have calculated something. It is written for CEGEP and undergraduate social science, where the class is a room of sociologists, economists, psychologists, geographers, historians, political scientists and anthropologists at once.
The mathematics in it is arithmetic applied carefully. Every symbol is named in words the first time it appears, every formula is followed by a plain-language statement of what it does, and a mathematics review sits at the back as a reference — never as a prerequisite. Nothing in the book assumes you should already know something.
Its four datasets are simulated, and that is the point rather than a compromise. One of them is a full population, which means you can draw a sample, compute an estimate, and then look up the true value and see how close you came. No real dataset can do that.
The Amazon.ca link above is an affiliate link (a paid link): if you buy after following it, Amazon pays me a small commission, and the price you pay is the same either way. The Amazon.com link is an ordinary link and earns nothing. The online materials are free and require no purchase.
The datasets, the replication code, the statistical tables and the solutions to the end-of-chapter exercises are free, and do not require a purchase.
What the book covers
The book runs in three parts, and the order is the order of an actual research project. Part I asks how you get from a question to data you can defend. Part II describes data once you have it. Part III asks what a sample entitles you to say about a population, and works through the tests and models that answer it.
Part I — Research Methods
- Introduction to Quantitative Methods
- Fundamental Statistical Concepts
- Introduction to Research Design
- Data Collection Methods
- Sampling Techniques
Part II — Descriptive Statistics
- Organising and Visualising Data
- Measures of Central Tendency
- Measures of Dispersion
- The Normal Distribution
- Bivariate Descriptive Statistics
Part III — Inferential Statistics
- Basic Probability Concepts
- Inference and Estimation
- Hypothesis Testing
- The Chi-Square Test
- Comparing Means
- Simple Regression
- Analysis of Variance
- Assessment and Interpretation
Appendices
- A. Mathematics Review — a reference, not a prerequisite
- B. The Datasets — how each one was built, and a codebook for every variable
Plus a glossary, a bibliography, and an index.
The z, t, chi-square and F tables are online rather than printed, and so are the longest of the dataset tables. Both are free, and the reasoning is in the next section.
Who it is for
- CEGEP students taking Quantitative Methods or Research Methods in the Social Science programme
- Undergraduates in sociology, political science, psychology, economics, geography, history, and anthropology
- Students who arrive expecting the mathematics to be the hard part, and need a book that does not assume otherwise
- Instructors looking for a text that pairs design and analysis in one volume, with data they are free to reuse
The data
Every dataset in the book is simulated. They were generated for teaching, they are described in full in Appendix B, and they are documented down to the permitted values of each variable. Some tables use real country and place names, but no figure in the book describes an actual person, household, city, or country, and no figure should be cited as a fact about the world.
There are four of them, and each exists to show something the others cannot.
| Dataset | Unit of analysis | What only it can show |
|---|---|---|
socsurvey |
Respondent | Attitude scales, reverse coding, missing-value codes, individual-level association |
censuspop |
Person, within households | A population you can actually sample from — sampling distributions, clustering, the independence assumption |
cma_panel |
Metropolitan area × wave | Time — trend, definitional breaks, seasonality |
worldsim |
Country | The country as case — log scales, cross-national comparison, the ecological fallacy |
The datasets and the R scripts that generate and verify them are released under a Creative Commons Attribution 4.0 International licence. They may be used, modified, and redistributed, including commercially and in other teaching materials, provided the source is credited. Instructors elsewhere should be able to teach from this data without asking permission. The datasets exist to be used.
Download the datasets and codebooks →
Everything that comes with the book
Some things belong in a book and some do not. A dataset table of two thousand rows is not something anyone reads on paper; the solutions to every end-of-chapter exercise would have added roughly ninety-six pages and, worse, would have capped how many exercises each chapter could carry; and the four statistical tables cost twenty pages that a student can reach faster on a phone. All of it is online instead — free, and without a purchase.
| Resource | Read online | Download |
|---|---|---|
| Solutions to the end-of-chapter exercises | Chapter list | All chapters (PDF) |
| Statistical tables — z, t, chi-square, F | All four tables | |
| Dataset tables — the long ones, in full | About the data | |
| The four datasets, with codebooks | Data page | ZIP |
| Replication code — every script that builds the book | What is in it | ZIP |
| Errata | Known corrections | — |
The solutions to the exercises inside each section stay in the printed book, immediately after the exercises they answer. That is deliberate: those are a self-check, and the immediate answer is the whole point of them. Moving them online would turn a self-check into homework.
Editions
- First edition (2026) — this page.
When a second edition appears, this page moves to
/books/making-sense-of-social-data/1e/ and keeps its own
online materials there permanently, so that a link or a citation to
the first edition never breaks and a student working from an older
printing still gets the solutions that match their book.
For instructors
Slides, an exercise bank, a sample syllabus, and an instructor guide are available to anyone teaching from the book. The instructor guide is where the commentary lives that is deliberately kept out of the student solutions — what the strongest answers notice, what to give credit for, and where students reliably go wrong.
Errata and feedback
Corrections go into the next printing, and they are genuinely welcome — from students as much as from instructors. If you find an error, or something that is simply unclear, tell me and I will fix it.